Your energy, drawn round the day
When are you most productive? Reassign draws a per-hour energy curve around its 24-hour dial: a circadian and sleep-pressure model bent by your real sleep, caffeine, and naps, so you plan deep work for your peak hours.

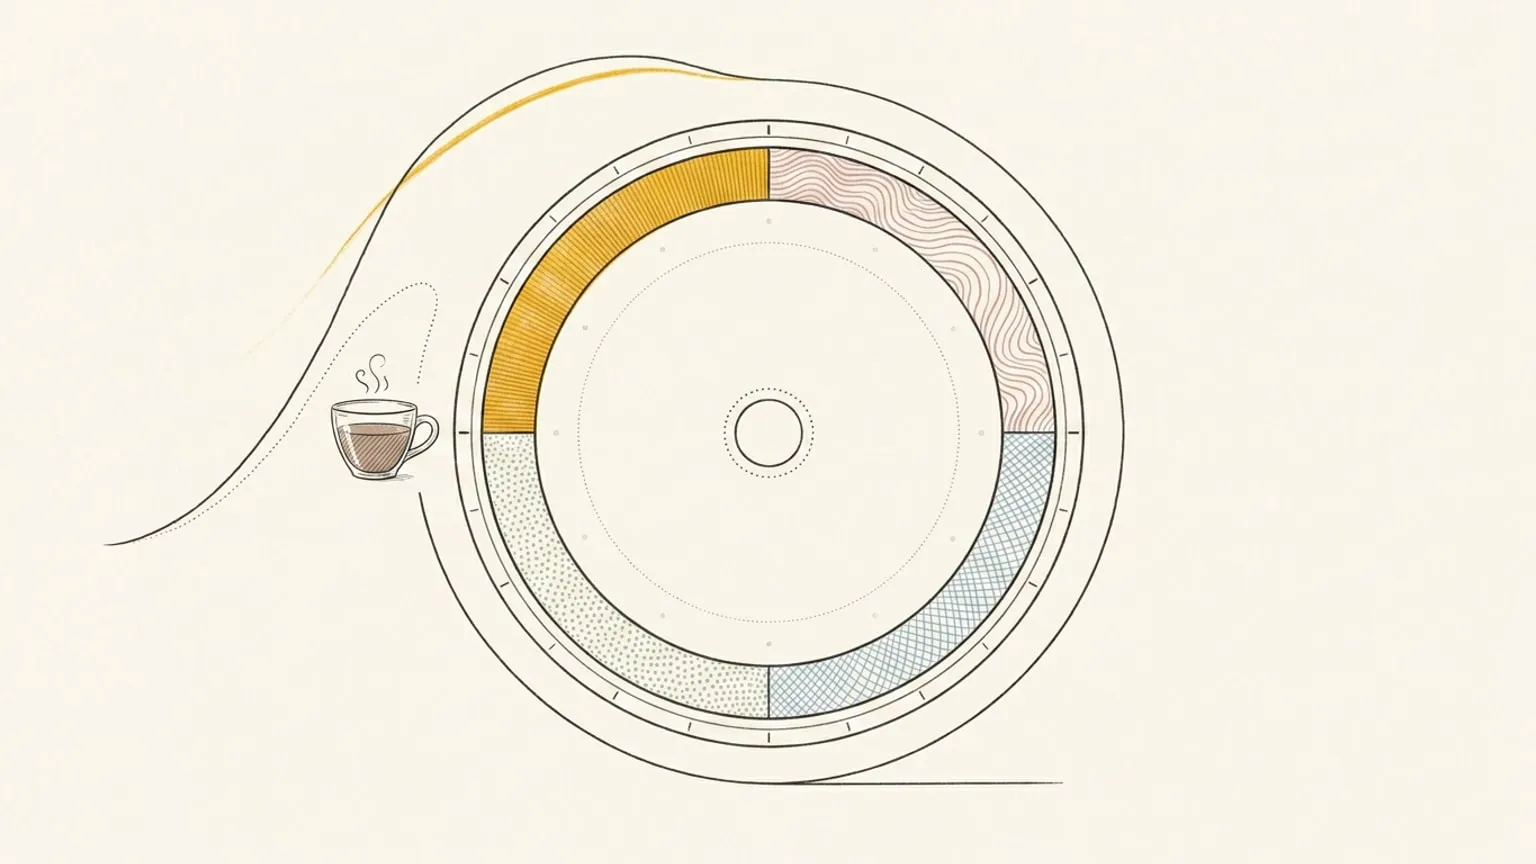
A calendar tells you when you’re free. It has never once told you whether you’ll be any good at the thing you put there.
So we plan against ourselves. We drop the hardest task of the week into the 3pm slot because the slot was open, and then spend that hour pushing a boulder we’d have rolled at 10. The slot was free. We were not sharp. Those are different questions, and a column of empty time can only answer the first.
The dial can answer the second.
This is the piece about what we drew. If you’re here for the longer answer to when your energy actually is, and why the ADHD curve so often sits hours off the average one, start with the energy management piece and come back. For how the discipline differs from classic scheduling, read energy management vs time management.
When are you most productive? The day already has a shape
You know your own curve, roughly. A climb through the morning to a late-morning peak. A dip after lunch that everyone pretends isn’t real. A second wind in the early evening, then the slow fade toward sleep. It isn’t a mood and it isn’t willpower; it’s physiology, and it’s surprisingly regular.
Sleep scientists model it with two processes that pull against each other. Process C is your circadian rhythm, the body clock that lifts and lowers alertness on a roughly 24-hour cycle no matter what you do. Process P is sleep pressure: the longer you’re awake, the more it builds, and a night’s sleep is what discharges it. Take the circadian lift, subtract the weight of sleep pressure, and you get a continuous line through the day, the same line you feel as “sharp now, foggy later.”
That line is a series over the hour. And on a 24-hour dial, the hour is already the angle. So energy, like the weather before it, doesn’t need its own chart. It wraps the ring you’re already reading.
Want to see your own baseline before reading on? The free circadian rhythm calculator draws the population version of this curve from just your usual sleep times, in the browser, no signup. It is a prediction, not a measurement. Studying? See when is the best time to study.
What we drew
Turn on Energy from the Layers control and a curve settles around the dial: high where you’re likely to be sharp, low where you’ll flag, falling away into the hours you sleep. It’s not a generic chart of “most people.” It’s bent to your day in three ways.
- It starts from your clock. Tell Reassign your bedtime and how much sleep you need, once, and the two-process baseline draws itself against your wake hours. Set a 23:00 bedtime and an eight-hour need, and the curve knows when you rise and when pressure starts to build.
- It reads your real day. The caffeine, the naps, last night’s short sleep: Reassign scores the blocks on your dial for the lift or drag each one adds, and folds them into the line. A coffee at 9 lifts the late morning; a 2pm nap softens the afternoon trough; a five-hour night drags the whole day down. You don’t tag any of this by hand, the classifier reads it from what’s already there.
- It calibrates to you. The model is a starting point, not a verdict. Over time it tunes toward your own pattern rather than the textbook one, which matters most for the people whose curve is furthest from the average: night owls, shift workers, and the ADHD brains the dial was shaped for.
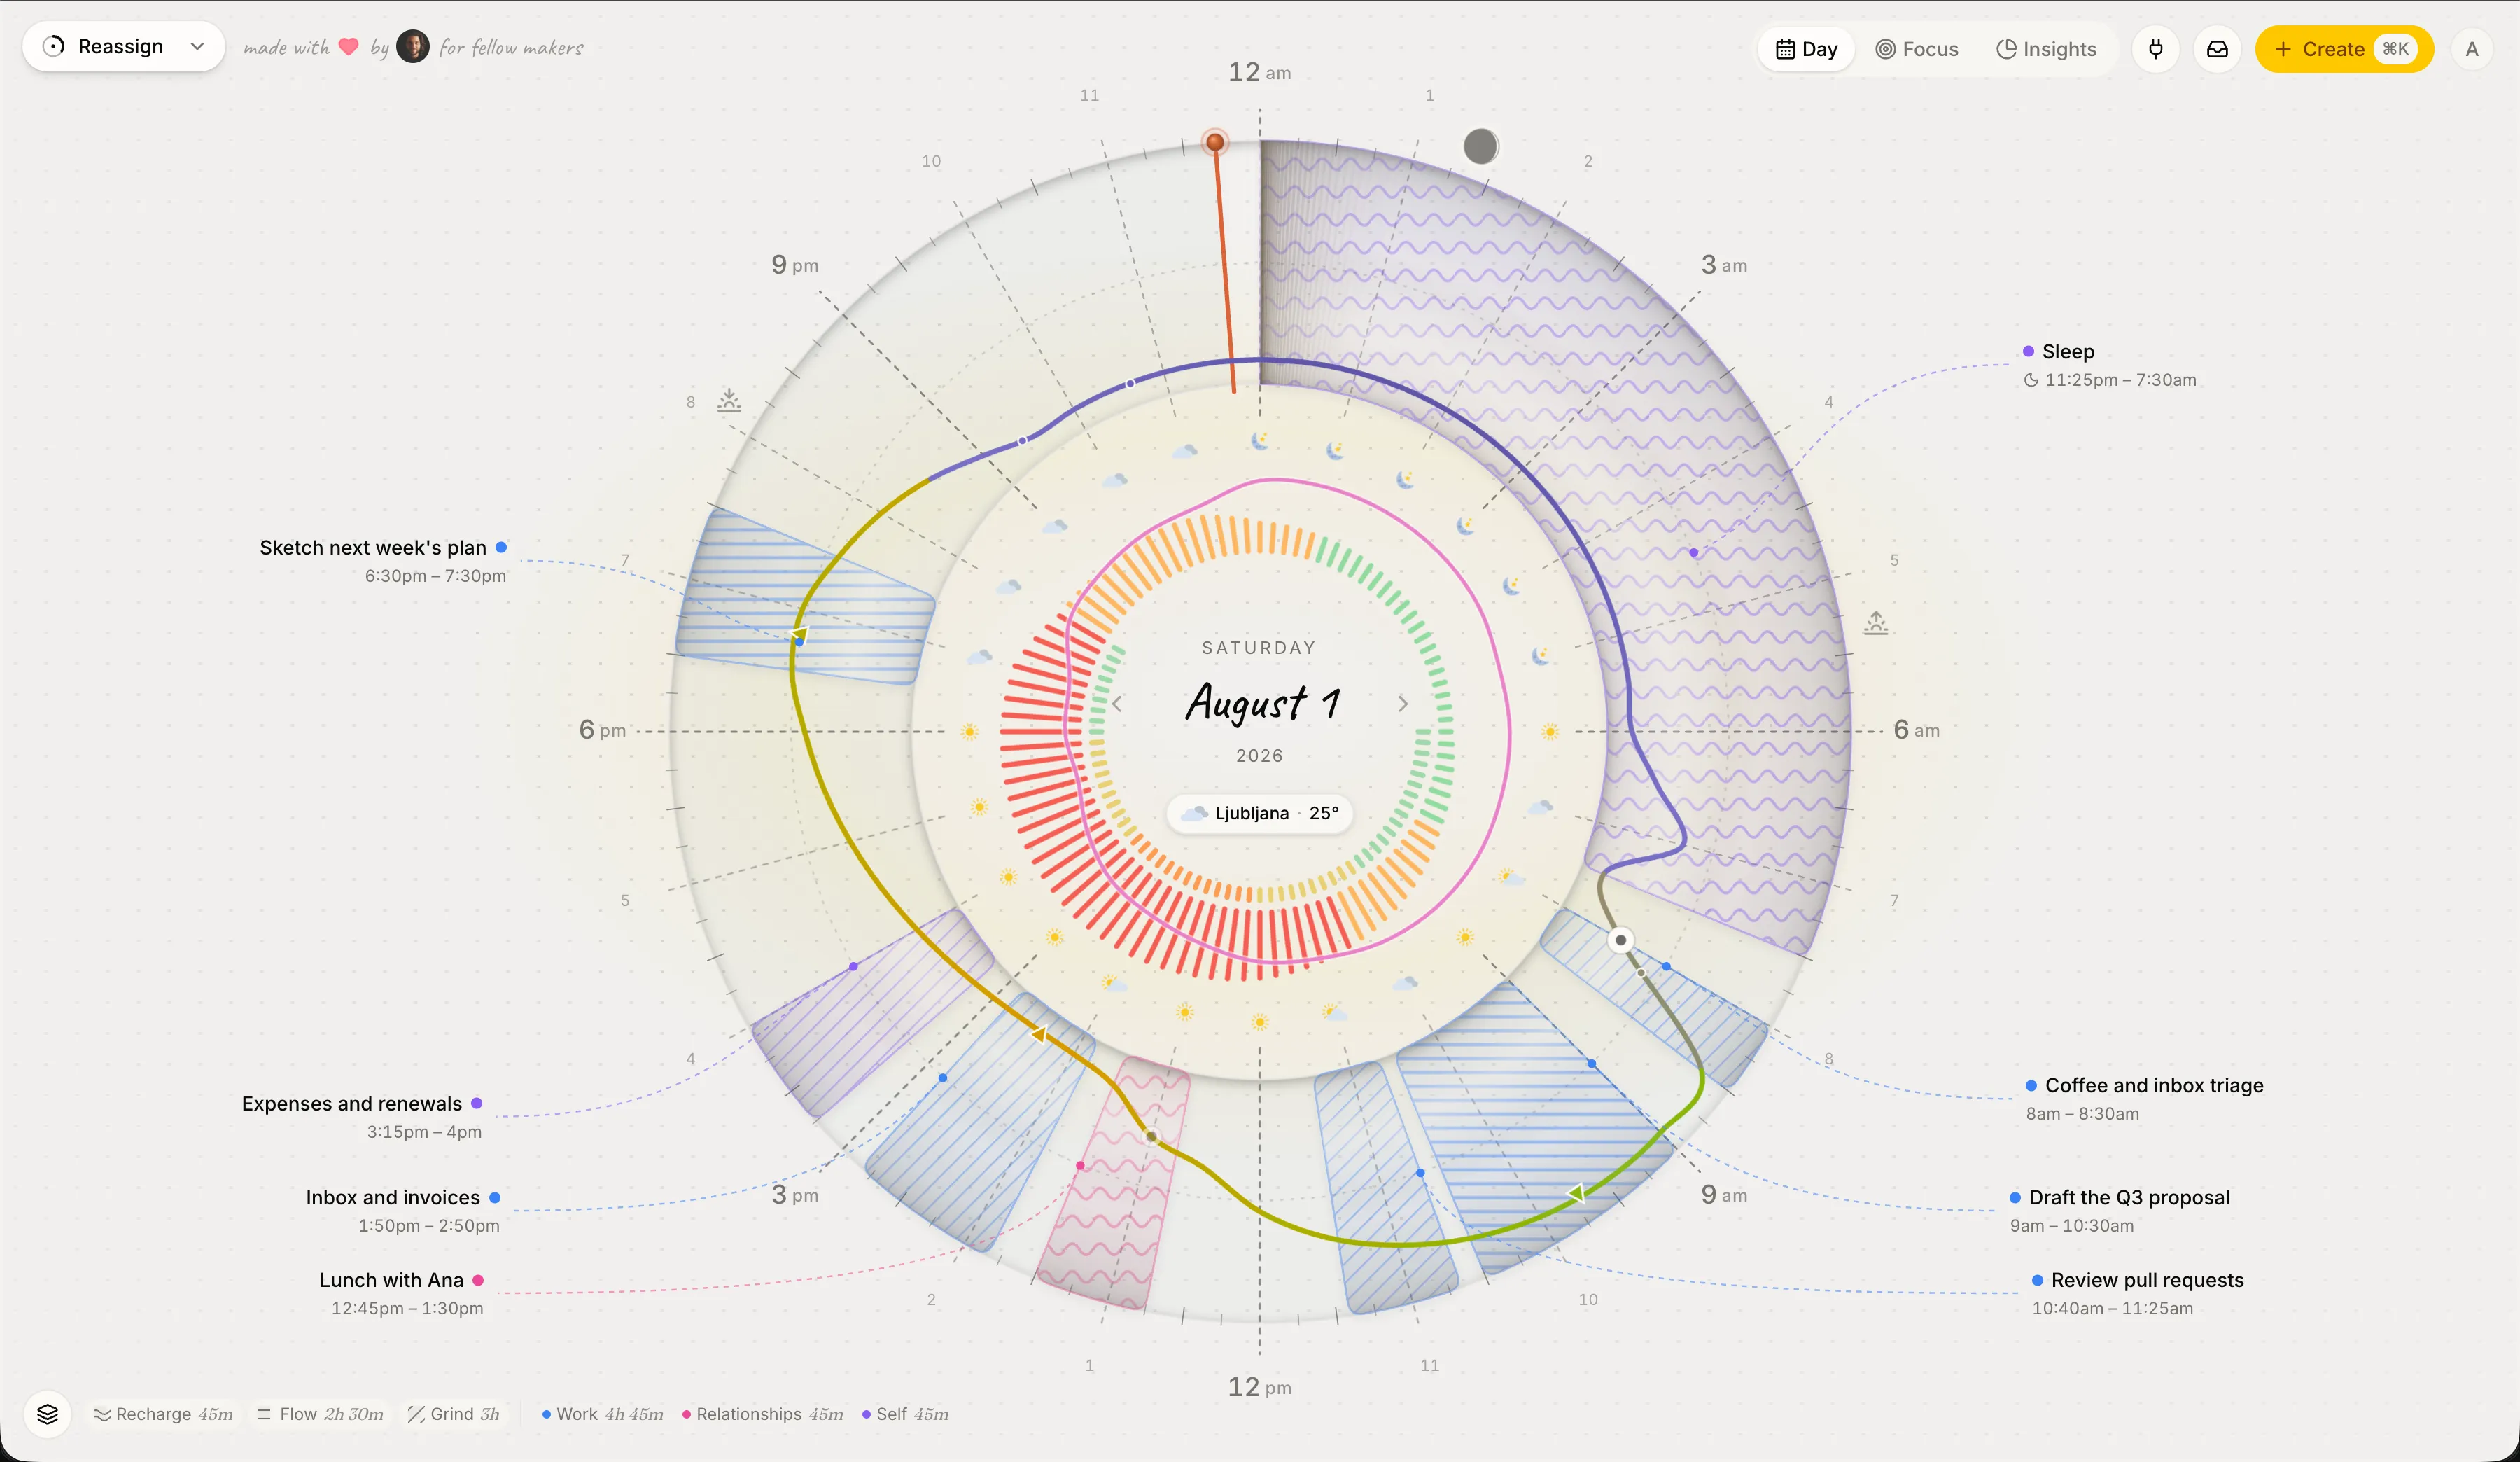
And because it’s a clock, each block sits against its own slice of the curve. The popover on an event carries a small energy meter, so “should this go here” stops being a guess and becomes something you can see: the deep-work block landing on the climb, ready to run in focus intervals, the admin landing in the trough where it belongs.
It unlocks on a single night
The honest problem with anything modelled from sleep is the cold start: a tool that needs two weeks of data before it shows you anything is a tool you quit in week one. So the curve draws as soon as it has the one night it actually needs, last night. Log a single night’s sleep and today’s line lights up. No warm-up, no streak to maintain before the feature turns on. No wearable is needed. Lifestack also supports manual sleep entry, alongside optional wearable connections; the comparison covers the different ways each app presents the day.
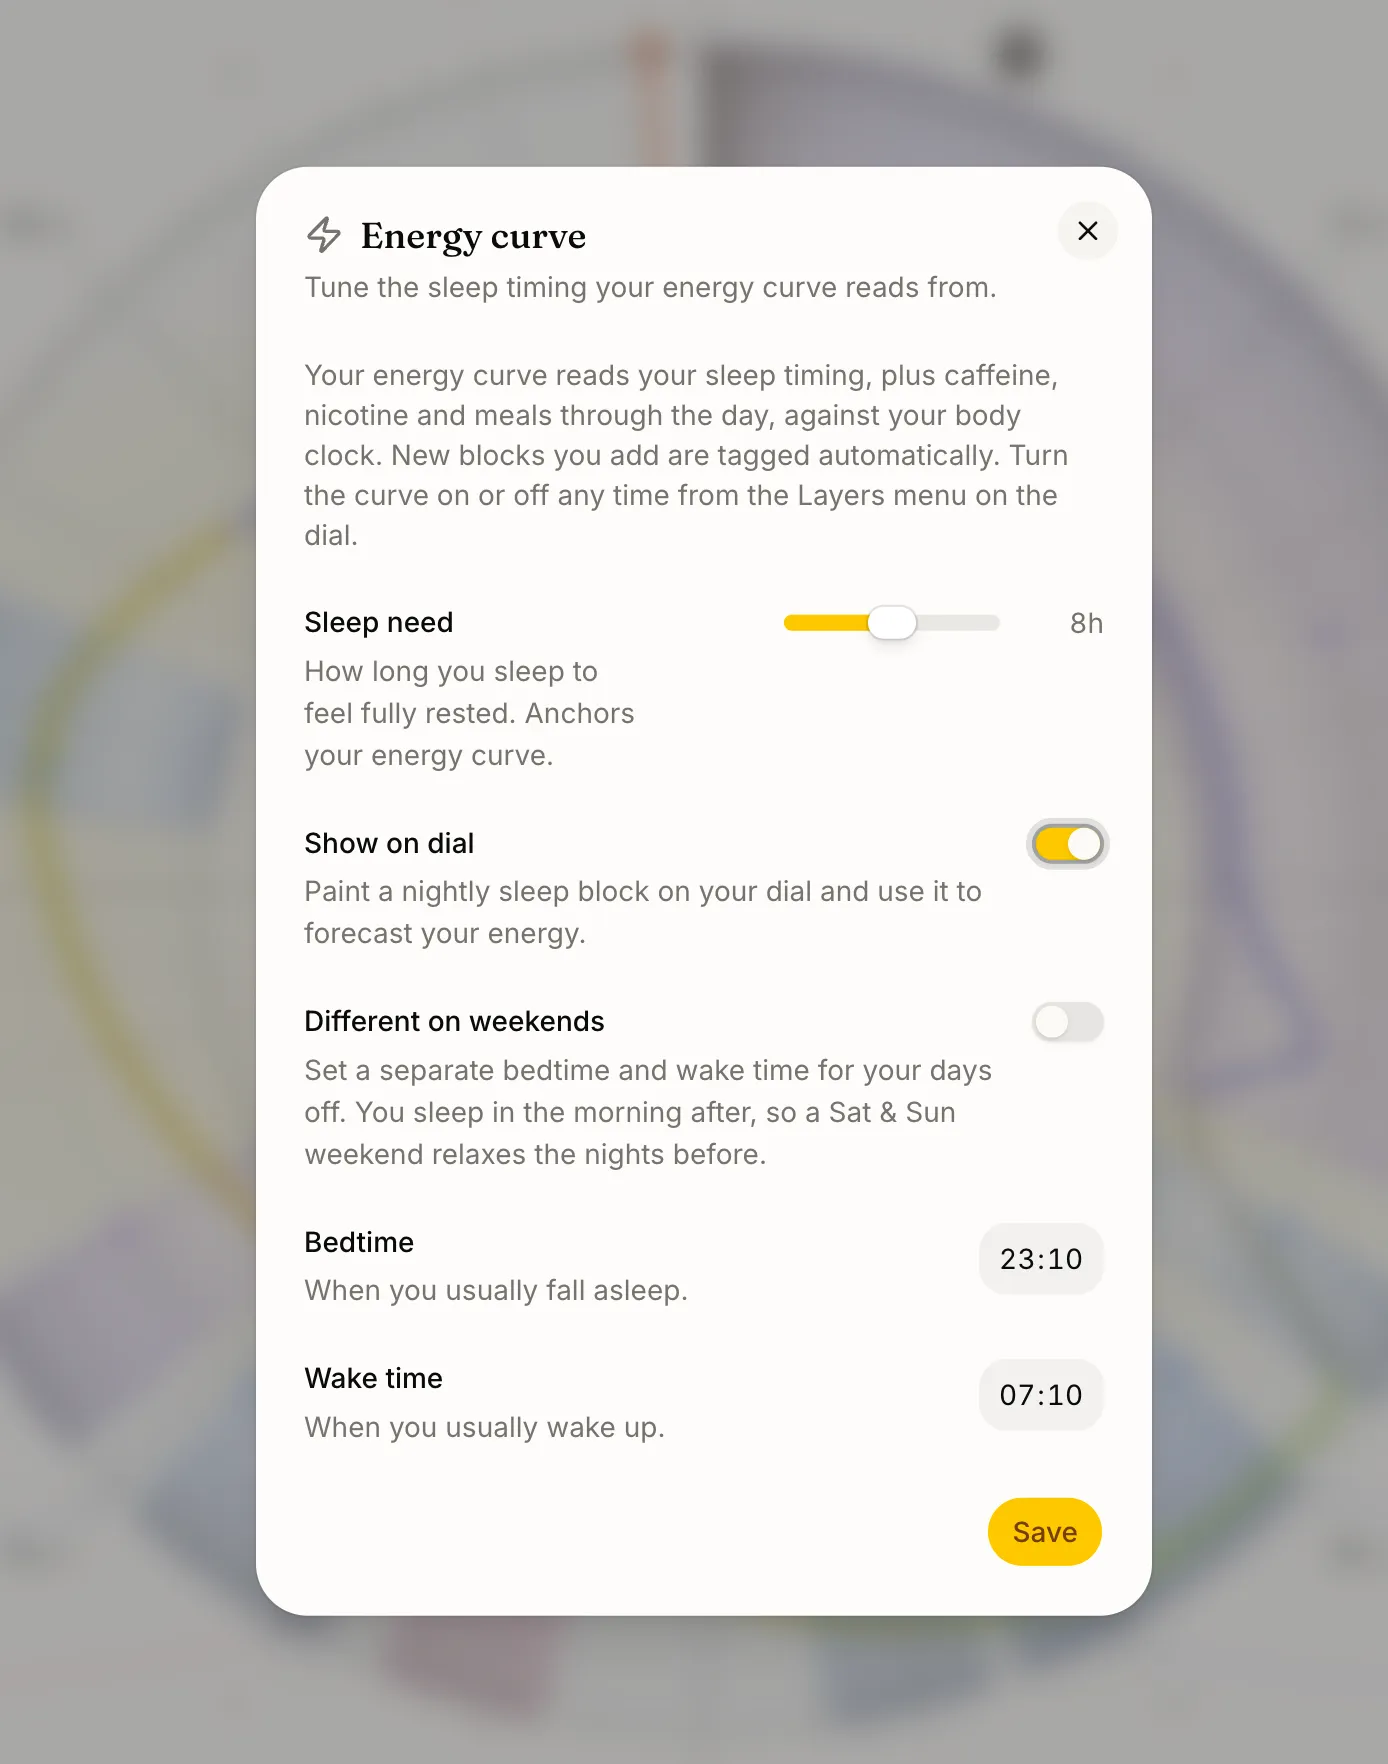
A focused Energy setup opens straight from the Layers menu, the bedtime, the wake time, the sleep need, all in one place, instead of buried in a settings accordion. Bedtime is the anchor you keep; slide your sleep need and the wake edge moves to match.
It holds the past, too
The energy curve isn’t only a forecast. Step back to a day you’ve already reflected on, and the line redraws around what actually happened: if you marked that you slept from 1am to 6am instead of the eleven-to-seven you’d planned, the past day’s energy reads the night you really had. The same honesty reflection brings to your plan, it brings to your energy. Today and tomorrow, which you’ve never lived yet, draw from the plan; yesterday draws from the truth.
One more rhythm, if you want it
The curve can carry the menstrual cycle too. Opt in to Cycle rhythm in the energy settings, log a period start (one tap a month, from the + Add menu, the ⌘K palette, or a right-click on the dial), and the line bends with where you are in your cycle: a small, research-hedged late-cycle dip at first, reshaped by your own mood logs into your pattern, or into nothing, if nothing is what you feel. It’s off by default, asks for its own explicit consent, never asks your gender, and its data is excluded from analytics, email, AI, and MCP, with a one-tap delete behind the off switch. What the evidence supports, and what it doesn’t, gets its own piece.
A second layer, and the bigger picture
Weather was the first overlay on the dial. Energy is the second, the line the weather post promised was “waiting in the menu, marked Soon.” Same small control, same idea: another reading of the same twenty-four hours, switched on when you want it and gone when you don’t. The dial holds your plan, the forecast, and now your energy at once, without any of them shouting over the rest.
Step further back and those readings add up. The new Time Insights view turns the days you reflect on and the moments you track into a picture of the weeks: where your time actually goes by area and activity, how the days felt, your sleep debt, and what recharged you against what drained you. The dial is where you live a day; Insights is where you see the shape of many.
It comes into the chat, too
Like the weather, energy isn’t trapped in the app. When you plan with Claude over MCP, get_schedule with includeEnergy: true hands it your peaks and dips, your current reading, and what’s driving them, alongside your events and free slots. Set from and to to the same date for this one-day read. So scheduling by alertness becomes something you can simply ask for:
“Put the hard writing where my energy is highest tomorrow.”
“Don’t book anything demanding in my afternoon dip.”
The curve paints on the in-chat dial as well, once you’ve switched the layer on, so Claude reads the same line you see, and plans the day to fit it.
Energy is part of Pro. Tell Reassign how you sleep, log a night, and switch on the layer, and the day stops being a row of open slots. It becomes a shape, with the hours you’ll be sharp drawn right where they fall, so the hard thing finally lands where you can do it well.
Frequently asked
- Does Reassign show my energy on the dial?
- Yes. The Energy layer draws a per-hour energy curve around the 24-hour dial: it rises into the hours you're likely to be sharp and dips where you'll flag, so you can schedule by how you'll feel, not just by what's free.
- How does the energy curve know my energy?
- It starts from a two-process model of how alertness works: a circadian rhythm (your body clock) lifts your alertness, while sleep pressure (how long you've been awake since you last slept) drags it down, and the two combine into a continuous curve. Then it bends that baseline to your actual day, scoring the caffeine, naps, and sleep on your dial for the lift or drag each one adds, and calibrates to you over time. No wearable required.
- Do I need a smartwatch or fitness tracker?
- No. The curve is modelled from the sleep you log and the day you plan, not from a wearable. You tell Reassign your bedtime and how much sleep you need; logging a single night is enough for today's curve to draw.
- Is the energy feature free?
- Energy, weather, mood, and custom moment tracking are all included in Pro and the 7-day no-card trial.
- Does the energy curve work on past days?
- Yes, and it's reflection-aware. On a day you've looked back on and marked up, the curve reads the sleep you actually got rather than the night you'd planned, so the past day's energy reflects what really happened.
- Can Claude see my energy when I plan over MCP?
- Yes. For one day, get_schedule with includeEnergy: true gives Claude your peaks and dips, today's current reading, and what's driving it, alongside your events and free slots. Set from and to to the same date. The curve also paints on the in-chat dial when you've switched the layer on.
- Can I turn the energy layer off?
- Yes. Energy is a layer, toggled from the Layers control at the bottom-left of the dial. It's off by default; switch it on when you want it and off again when you don't.
- Can the energy curve follow my menstrual cycle?
- Yes, if you opt in. Cycle rhythm is off by default and asks for its own explicit consent. Log a period start, one tap a month, and the curve bends with your cycle: a small, hedged late-cycle dip at first, calibrated by your own mood logs into your pattern. Cycle data never reaches analytics, email, AI, or MCP, and one tap deletes it.